According to the Bank of Italy1, since the beginning of the pandemic, about 15% of households have applied or considered applying for a loan from a bank or finance company.
But how easy is it to view a free online quote for a loan here in Italy? We asked our community to test the digital procedure of the nine most popular credit companies.

Loan application trends for 2021
After opening a bank account and getting a car insurance quote, the time has come for our (crowd)testers to ask for a loan quote. Before looking at the results, let's make a few remarks on the trends for 2021. While the demand for mortgages is declining, the number of consumer credit applications is expected to increase between +7% and +12% compared to 2020, a range that rises to 10% and 20% for personal loans2.
Liquidity (or personal) loans account for 30% of the total in Italy (the remaining 70% are special-purpose loans). In the first quarter of 2021, the average age of those who requested a loan was 42 years3.
We therefore asked ourselves:
- How many clicks does it take to request an online loan quote?
...but more importantly, considering that it is not the very young who are asking for it:
- How user-friendly and reliable are websites perceived to be?
Research and Method
In the week between 24 and 31 March, together with our community of testers, we asked for a free online loan quote from nine of the most popular credit companies in Italy, counting the number of clicks needed to achieve the goal.
The nine companies were: Agos, Cofidis, Compass, Fiditalia, Findomestic, Pitagora, Prestitalia, SiglaCredit, and Younited.
As always, before we reveal the results, some clarifications are necessary:
- Clicks were counted starting from the homepage of the specific website (once the tester had found the fastest way to get to the loan application process);
- The count ended with the display of the quote for those companies that allowed it, and with the sending of the quote request for those that wished the customer to proceed with a second step (usually a phone call);
- The reported results (both clicks and other variables we’ll see later in the research) are the average of the results of several testers;
- The completion of an anagraphic field was counted as one click. Clicks for selecting possible form-filling suggestions were not counted;
- Only clicks for filling out mandatory fields were counted, any extra, non-compulsory information was not counted;
- The research focused on the number of clicks needed to request a quote; it did not take into account the time taken to achieve the goal;
- The study ended when the first quote was displayed (for those companies that allowed it) or with the conclusion of the online application process; this means that the approval or acceptance of the loan was not checked;
- For companies that allowed fast quotation (i.e. without entering verification documents), the counting stopped in any case at the display of a quote.
The other variables involved
To further emphasise that the number of clicks is not the only element on which we can base the usability of the website (or app), we will present results related to other variables.
In the click challenge on the car configurator, for example, more clicks were linked to a higher number of possible customisation clusters. Or, as in the case of opening a bank account, more clicks could be linked to more elaborate security procedures, a factor that users do not dislike.
In the case of the online loan estimate, we asked our testers to evaluate the following variables, in addition to the number of clicks:
- satisfaction
- usability
- design
- information capacity
- reliability
So here's how it went.
The results of the Click Challenge
Our testers carried out the online procedure for requesting a quote on the websites of Agos, Cofidis, Compass, Fiditalia, Findomestic, Pitagora, Prestitalia, Sigla Credit and Younited Credit. At the end of the process, they answered a User Experience questionnaire.
Before moving on to the results, remember that not all the sites analysed allow you to view the loan quote. The numbers below refer to the clicks made to complete the online process (which, for some websites, resulted in the display of the quote, for others, the end of the first step). Details on the two categories will be given in the following paragraphs.
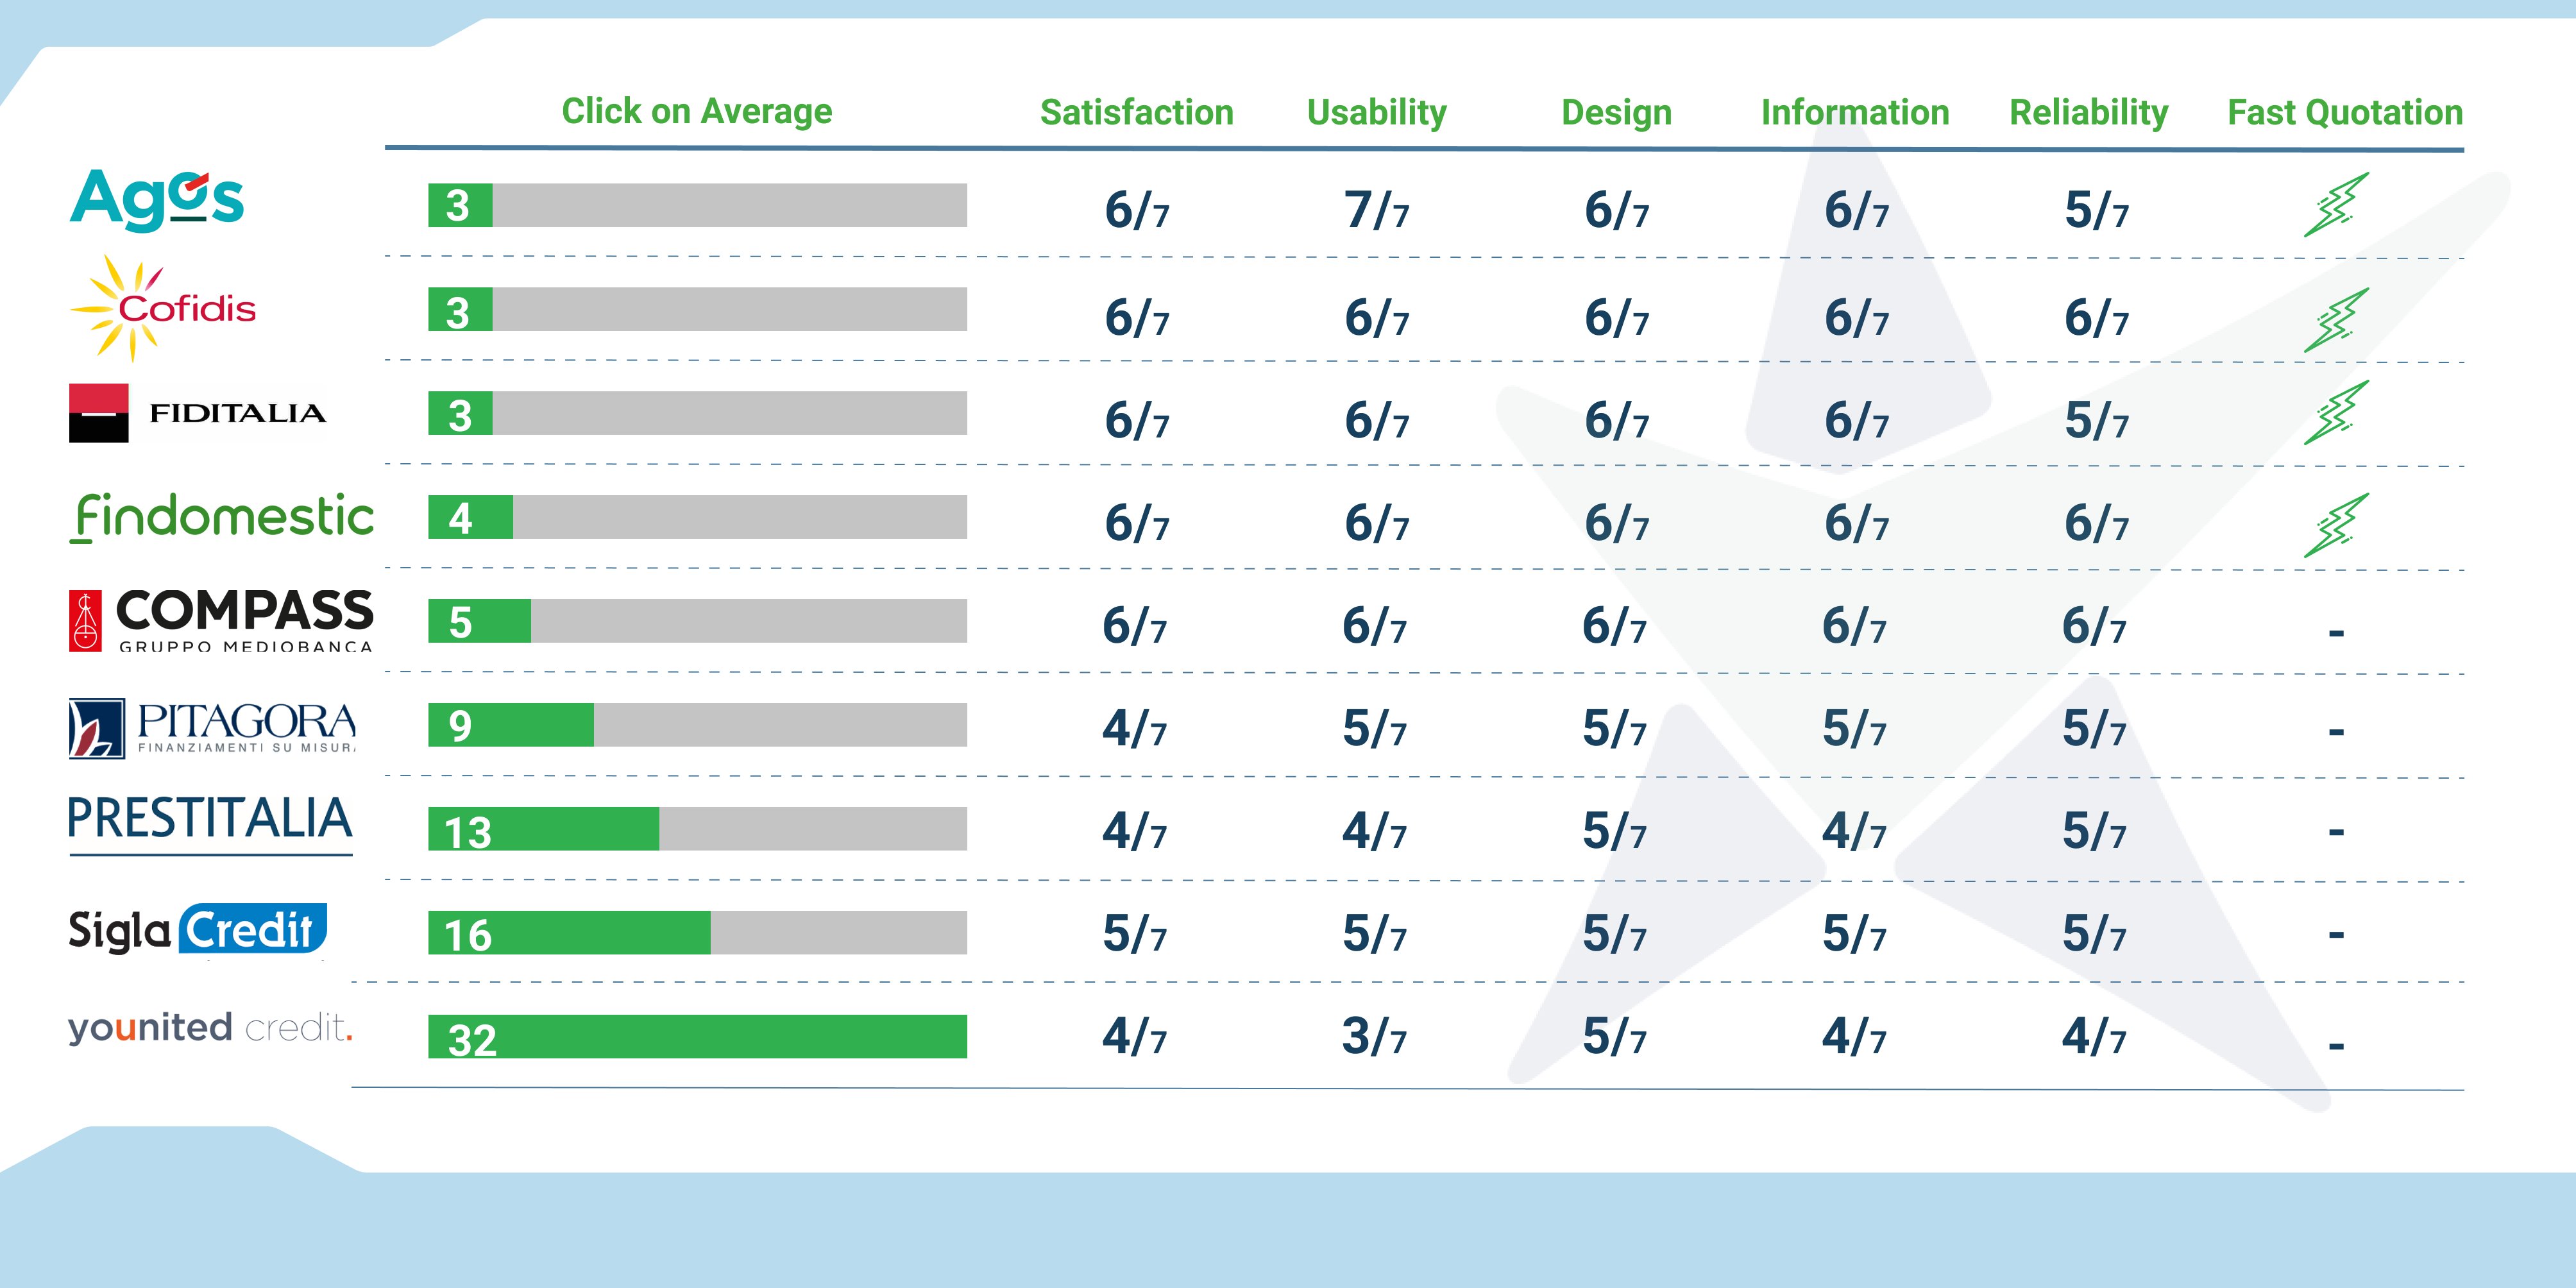
Note: the scale in sevenths is typical of user experience research.
The number of clicks needed is apparently uneven among the companies included in the study. The standard seems to be a few clicks (between 3 and just over 10) and only two exceptions come in at 16 and 32. However, let's make some clarifications.
As we have already mentioned, not all companies have made it possible to view the loan at the end of the online procedure. Some of them required a telephone call. Prestitalia, Pitagora and SiglaCredit fall into this second category. Here we have to make another note, namely: it is true that fewer clicks = less data to be entered, but this data could also be requested in a second phase by those financial institutions that allow fast quotation.
Contrary to the situation in other challenges, where more clicks meant (or could be interpreted as) greater security or personalisation, here, the number of clicks was inversely proportional to the perceived quality of the experience. More clicks correspond to reduced user satisfaction and usability. At the same time, a high number of clicks does not seem to be related to the perceived reliability and information capacity of the website. In order to understand whether the values are actually linked and thus whether there is a causal effect, however, a special study (a Customer Journey Test) of the process proposed by each individual company would be needed. On the page linked to the green text, you can contact us for further information.
Conclusion
As for the previous #clickchallenge (link at the bottom of the article), the click count must in no case replace a usability study. Instead, its aim is to encourage companies to make the user experience easier and faster and to keep up with technological developments.
The number of clicks, therefore, is only an initial numerical data analysis, but the scope for reflection is much broader, as can be seen from the many other variables we have chosen to include in the study.
If the average age of the target audience for online quotation requests is rising, simplicity takes on an even higher value given the lower level of e-skills and increased likelihood of distrust in the web. The solution is therefore to focus attention on the conversion funnel and its optimisation (regardless of the number of clicks).
In making this process user-centric, it is essential not to forget about the end user. From the design phase to post-release, bringing the real customer or prospect into the process is undoubtedly the most effective way to improve usability, user experience and satisfaction.
That's exactly what we do at UNGUESS – we help businesses improve the experience by asking real users directly for their feedback. Thanks to this methodology it is possible to build the best possible conversion funnel for the real target.
Mentioned sources (in Italian):
2Richieste di credito delle famiglie: si conferma il trend in discesa
3Prestiti personali: cosa sono e le tendenze per il 2021
More click challenges: